As of the end of the U.S. federal government's 2011 fiscal year on 30 September 2011, the United States' total public debt outstanding was recorded to be approximately $14.790 trillion. From the end of the U.S. government's Fiscal Year 2010, the amount of the U.S. national debt has increased by 9.1% in just one year, or $1.2 trillion.
The chart below provides a preliminary look at who the biggest holders of all the U.S. government's public debt outstanding were as of 30 September 2011:

Comparing this new chart with ones we've previously featured, we've broken out the U.S. Federal Reserve's holdings from the U.S. Individuals and Institutions category, reflecting the Federal Reserve's massive purchases of U.S. Treasuries as part of its quantitative easing programs.
Overall, in the year from 30 September 2010 to 30 September 2011, the U.S. Federal Reserve increased its purchases of U.S. government-issued debt from $966 billion to $1,773 billion, an 83.5% year-over-year increase.
These figures only include the value of securities issued by the U.S. Treasury or other federal government agencies. It does not include mortgage-backed securities, such as those issued by government-supported enterprises such as the Federal National Mortgage Association (Fannie Mae) or the Federal Home Loan Mortgage Corporation (Freddie Mac).
Our look at who owned the largest shares of the U.S. national debt is only preliminary since the data for foreign nations will be revised at some time in 2012.
How Much Will Upcoming Revisions Change This Picture?
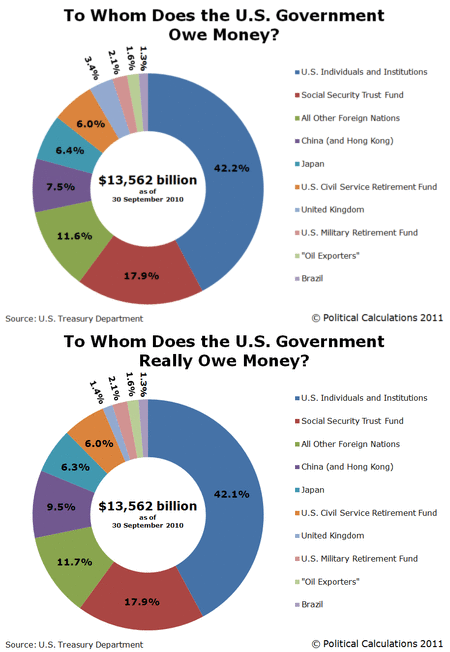
We've created an animated version of our two primary charts revealing the major holders of U.S. government issued debt through the end of Fiscal Year 2010, our original version and the updated version incorporating the U.S. Treasury's revised data, to help give an idea of how much the values and percentage shares presented in our new chart above might change when the data spanning Fiscal Year 2011 is revised:

Note that the biggest change is that the share of U.S. government-issued debt held by China increases at the expense of the originally reported level of U.S. Treasuries held in the U.K. We anticipate a similar change when the data is revised in 2012, although this year, Europe's ongoing debt crisis might be playing a role in inflating the U.K.'s reported share of U.S. Treasury securities as well.
Previously on Political Calculations
Who Owns the U.S. National Debt
To Whom Does the U.S. Government Really Owe Money?
Summer Update: To Whom Does the U.S. Really Owe Money
Data Sources:
Board of Governors of the Federal Reserve System. Monthly Report on Credit and Liquidity Programs and the Balance Sheet, October 2011. Table 1. Assets, liabilities, and capital of the Federal Reserve System.
Board of Governors of the Federal Reserve System. Monthly Report on Credit and Liquidity Programs and the Balance Sheet, October 2010. Table 1. Assets, liabilities, and capital of the Federal Reserve System.
U.S. Treasury Department. Major Foreign Holders of Treasury Securities. Accessed 6 December 2011.
U.S. Treasury Department. Monthly Statement of the Public Debt of the United States, September 30, 2011. Table III – Detail of Treasury Securities Outstanding, September 30, 2011.